


How to Increase Clinical Simulation Program Visibility

Visibility of productivity in a healthcare simulation program is a great way to increase awareness and return on investment to faculty and institutional leadership. By marketing a clinical simulation program, teams can better demonstrate educational outcomes and opportunities to all stakeholders. Displays of throughput data that a clinical simulation program has completed is helpful to all involved for different reasons. Beneficiaries of this data include financial contributors, clinical simulation participants such as learners and faculty, potential future students, and the community. This article by Erin Carn-Bennet will explore the use and utility of creating a structured infographic report to increase visibility of a successful healthcare simulation program.
Visibility of clinical simulation reports can be tailored to unique healthcare simulation program needs. An example of displaying tailored report findings would include feedback on individual clinical simulation training courses versus feedback of a month of logged trainings. Infographics are colorful and display meaningful and purposeful data in an easy to read format for the consumer of data displayed.
The Douglas Starship Simulation Program is lucky enough to have a long-standing reciprocal supporting relationship with Sydney Children’s Hospital at Randwick in regards to sharing clinical simulation resources. Sydney Children’s Hospital kindly shared a document that they had created on Visme. Visme is a collaborative creation and design platform with a number of useful utilities available that are adaptable for any institution.
Sponsored Content:
Sydney Children’s Hospital at the time had created a template to report on clinical simulation team training course learnings and feedback to participants. Content shared within the infographic report is de-identified and generalized to maintain clinical simulation participant psychological safety. Details of the clinical simulation case are broad to ensure learning outcomes for future participants are not diluted when relating to individual courses. Individual course learnings are sent to participants of the course only; however a monthly report is displayed and shared more broadly.
The Visme clinical simulation infographic report from Sydney Children’s Hospital idea was then adapted by the Douglas Starship Simulation Program to create their own monthly productivity report of their clinical simulation program. The Douglas Starship Simulation Program used Canva as a design utility to create their infographic report. The Douglas Starship Simulation Program displays their productivity report on a noticeboard outside their home office but the report is in infancy and spread will grow with time and impact.
The productivity report was chosen to be used to display the impact of simulation based education and demonstrate productivity of the program. The Douglas Starship Simulation program has found use in investing in the Canva professional subscription and utilizes the design templates on a regular basis.
Sponsored Content:
Other potential ideas for use of a monthly productivity report include sending to the organizations clinical committees, clinical area management, executive level hospital management, externally linked organizations locally, nationally and internationally. A clinical simulation productivity report could also be utilized on a healthcare simulation website or within the clinical simulation team newsletter. An infographic productivity report can also be circulated prior to regular team meetings and discussed alongside the agenda or separately. The report could also be used in this context to review the previous month and also plan and project for the month ahead.
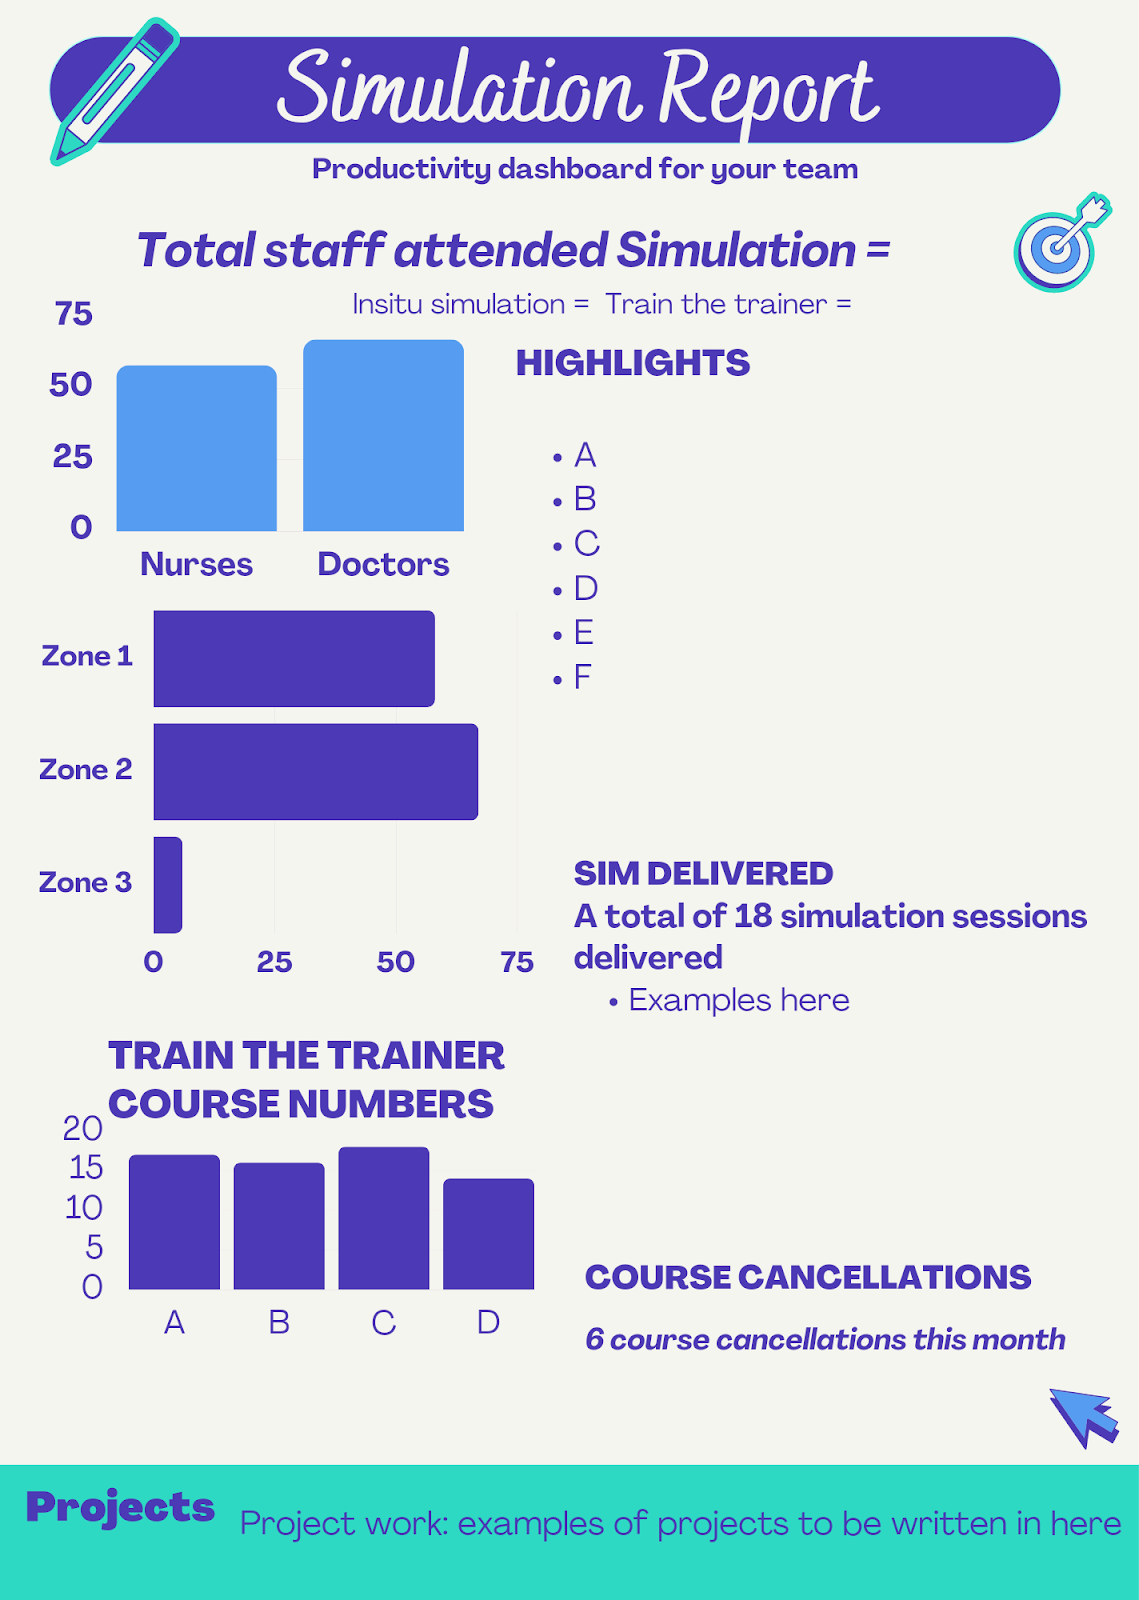
Key data is chosen to be shared on the visible productivity report. The data displayed in graph format includes the number of people that have participated in clinical simulation and also data broken down by clinical simulation zones (Roussin and Weinstock, 2017). Other sections currently include: highlights, current and upcoming research, conference work, latent safety threats identified, outreach training, testimonials, cancellations and the trainer courses completed. These data points are altered each month in order to ensure that an accurate depiction of the month’s work is displayed.
A clear plan of why the infographic report is being completed and who the target consumer is will guide clinical simulation programs as to what will be displayed within a productivity report. A quick search of Canva and Visme will display a vast array of infographic reports that can be adapted to suit clinical simulation programs.
A monthly productivity report is useful in keeping track of what clinical simulation scenarios and other educational utilities your program has completed. Analyzing this data can provide valuable insight into seasonal variations for clinical simulation programs. Other data of interest may include variations from month to month and which health care speciality is seeking clinical simulation based education. For program managers wanting to assemble data into annual throughput reports the data is easily transferable into an annual format from the monthly data already captured.
If the healthcare simulation program is dependent on financial donors then an infographic productivity report is an easy option to display both demand and delivery of a clinical simulation program. If the organization is seeking additional staffing, expansion or seeking financial donors then an infographic productivity report captured regularly can display demands and delivery nicely for presentation and business reports.
Having an identified staff member that takes on responsibility of collating the data will set up having the report completed successfully. The Douglas Starship Simulation Program has found having a large piece of butchers paper on the wall by the office door helpful. On the large piece of paper is a draft format of the report in whiteboard pen and once staff complete clinical simulation education this is recorded here.
At the end of the month this data is then tallied up and transferred onto the report template within canva pro. The shared team calendar where all clinical simulation training is booked onto is checked to ensure that no training has been missed in the final tally.
An infographic regular report to review success of healthcare simulation programs is an effective adjunct to review clinical simulation delivered. Utilizing a regular reporting system means that all stakeholders and team members have access to their clinical simulation programs throughput data. This article has explored options and design concepts to aid healthcare simulation programs organization’s options and rationale for taking this into consideration in the future.
Read More About Infographics in Simulation
Reference:
- Roussin CJ, Weinstock P. SimZones: An Organizational Innovation for Simulation Programs and Centers. Acad Med. 2017 Aug;92(8):1114-1120. doi: 10.1097/ACM.0000000000001746. PMID: 28562455.

Erin Carn-Bennett is a Simulation Nurse Educator for the Douglas Starship Simulation Programme in Auckland, New Zealand. Carn-Bennett has her Masters of Nursing and has an extensive nursing career within pediatric emergency and also nursing management. She is passionate about debriefing and all things simulation. Carn-Bennett is a member of the IPSS board of directors. Carn-Bennett is the lead host of the podcast Sim Nurse NZ.
Sponsored Content: