

Understanding Research For Medical Simulation, Part 4: P Values

Best practice in Healthcare Simulation is based on careful research. Simulation staff need to understand research theory in order to make informed decisions about future changes in practice and/or planned research studies. Research often involves statistical analysis which is a complex process. A basic understanding of P values however, can help the reader determine if a particular study has merit. This article, which is part of a series on research in medical simulation, starts with a simplified overview of P values and then continues with a slightly more detailed review of hypothesis testing. Below is a link to the entire series!
The meaning of P.
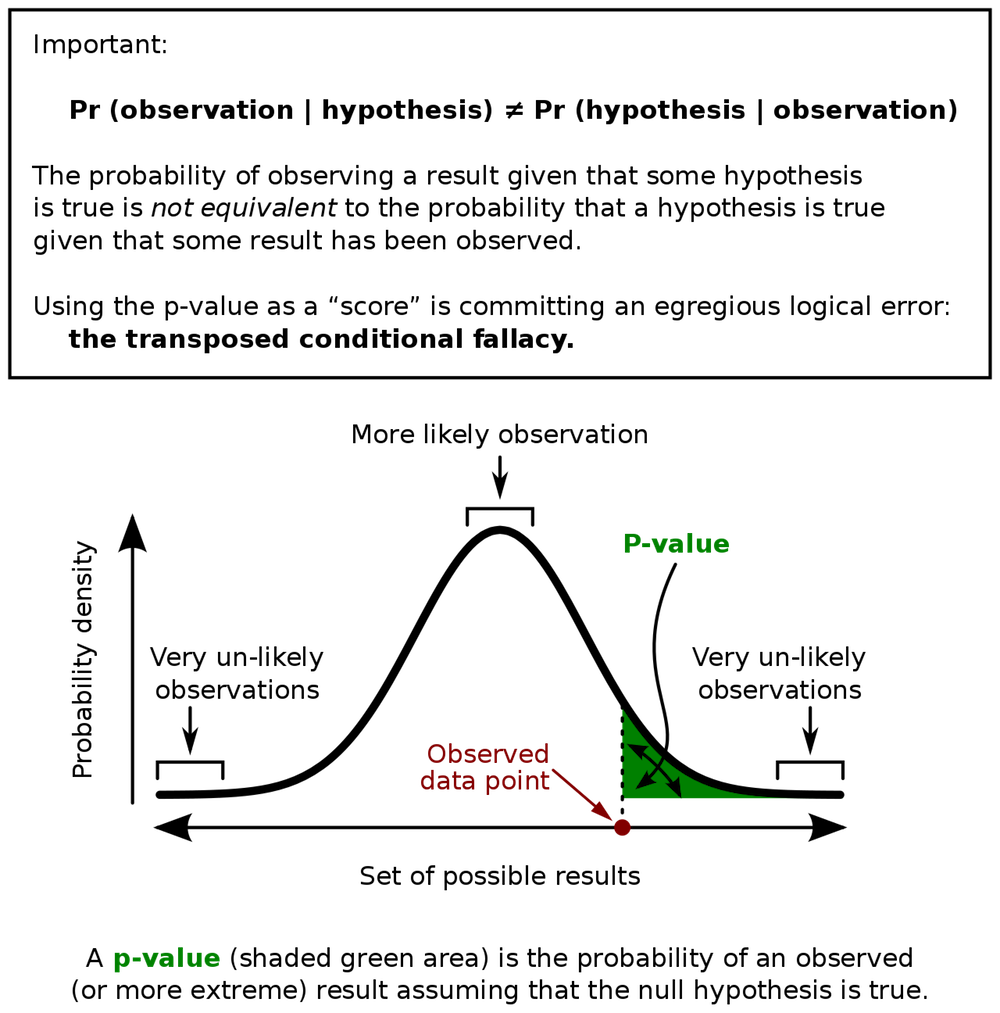
P value stands for probability value. The value of P, which ranges between 0 and 1, indicates whether a result occurred by chance alone. If the P value is small, the result was unlikely to have occurred by chance alone and the result is significant. When the P value is large, the result could have been due to sampling error but probably means the result is not significant. Frequently, the upper limit of probability is set at 10 percent (0.1), 5 percent (0.05) or 1 percent (.01). Note the limits of probability are set prior to the data analysis.
Sponsored Content:
- Suppose the significance is set at .05
- If p is < .05, the result is significant.
- If p is > .05, the result is not significant.
- E.g. if p = .002, which is < .05, the result is statistically significant.
- If the p value is .15, which > 0.05, the result is not statistically significant.
Hypothesis Testing
-
- Hypothesis – is a premise or claim that we want to test or investigate.
- This is usually done by various types of sampling.
- Null Hypothesis Ho. (Consider null is zero or currently accepted value for a parameter). Consider a study where we want to see if a medication lowers blood pressure. One group of patients will receive a placebo and another group will be given a test medication designed to lower blood pressure. Both groups will have their blood pressure measured.
- Assuming the null hypothesis is valid, there would no difference between the groups, i.e. there would be no significant difference between the blood pressure of the two groups.
- E.g. Ho = 140 mmHg (blood pressure) before and after medication.
- Alternative Hypothesis Ha or H1 aka Research Hypothesis.
- Involves the claim to be tested.
- Test to see if there is a difference between groups.
- Ha ≠ 140 mmHg (Blood pressure should be less following medication).
- Ho and Ha are mathematical opposites. The null hypothesis is assumed to be true unless evidence shows that it is not true.
- Since it is difficult to prove that something is true (i.e. the alternative hypothesis), therefore we can only:
- Hypothesis – is a premise or claim that we want to test or investigate.
- Reject the null hypothesis (Ho) in which case Ha ≠ 140mmHg
- Fail to reject the null hypothesis (i.e. we accept that Ho does equal 140 mmHg)
-
- Measure blood pressure of 50 individuals after placebo, mean = 140 mmHg
- Measure blood pressure of similar patients after receiving medication – (test value)
- Suppose we get a test group blood pressure of 138 mmHg. We might guess that this is so close to the original value that it is not significant. Suppose we obtained a value of 132 mmHg or even 120 mmHg We would me more likely to accept that these differences are significant.
- By using a statistical formula, we can predict the likelihood that the change is significant.
-
- Level of Confidence C – how much confidence do we have in our decision eg. 95% (.05) or 99% (.01). For example, can we be 99% sure that we can reject the null hypothesis and the result is significant.
- Level of Significance (alpha) ɑ = 1 – C
- If C = 95% or .95
- ɑ = 1 – .95 or .05
- General Test of Hypothesis Protocol
- State the null hypothesis and the alternative hypothesis
- State the level of significance
- State the test statistic
- Since the choice of test statistic affects sampling method, it must be chosen prior to sampling.
- Examples include paired t test, chi square test, correlation/regression analysis and ANOVA etc.
- Determine the critical value of the test
- Construct a decision line that displays the “do not reject Ho” region and the “reject Ho” region
- Determine the sample value when provided with a random sample drawn from a population
- State the conclusion:
- Based on a given data, at the alpha level of significance we do not reject (or rule out the null hypothesis).
- Based on the given data, at the alpha level of significance we reject (rule out) the null hypothesis and accept the alternative hypothesis.
Statistics can be a challenging subject! Best practice in medicine and healthcare education, including simulation methodology, is driven by research data. Changes occur when sound research data reveals that there are better ways of treating patients or educating practitioners. A basic understanding of research methods including statistics, helps simulation staff decide whether research articles are meaningful and significant.
Learn more about null values and statistics.
Sponsored Content:
Understanding Research for Clinical Simulation Series:
-
- Part 1: The Scientific Process
- Part 2: Validity and Reliability
- Part 3: Statistics
- Part 4: P Values
Subscribe to Our Free Newsletter For More Great Sim Research Help!
Today’s article was guest authored by Kim Baily PhD, MSN, RN, CNE, previous Simulation Coordinator for Los Angeles Harbor College and Director of Nursing for El Camino College. Over the past 16 years Kim has developed and implemented several college simulation programs and previously chaired the Southern California Simulation Collaborative.
Have a story to share with the global healthcare simulation community? Submit your simulation news and resources here!

Dr. Kim Baily, MSN, PhD, RN, CNE has had a passion for healthcare simulation since she pulled her first sim man out of the closet and into the light in 2002. She has been a full-time educator and director of nursing and was responsible for building and implementing two nursing simulation programs at El Camino College and Pasadena City College in Southern California. Dr. Baily is a member of both INACSL and SSH. She serves as a consultant for emerging clinical simulation programs and has previously chaired Southern California Simulation Collaborative, which supports healthcare professionals working in healthcare simulation in both hospitals and academic institutions throughout Southern California. Dr. Baily has taught a variety of nursing and medical simulation-related courses in a variety of forums, such as on-site simulation in healthcare debriefing workshops and online courses. Since retiring from full time teaching, she has written over 100 healthcare simulation educational articles for HealthySimulation.com while traveling around the country via her RV out of California.
Sponsored Content: